Page with the result of semantic annotation can be opened from the List of tasks by the "Window-arrow" button in the Action column of the table with tasks. Here you can see the result of classifications, disambiguations, subject column detections and relation discovery process, adjust feedback for the algorithm and export resulting annotations in the form of extended CSV file, JSON annotations and RDF triples.
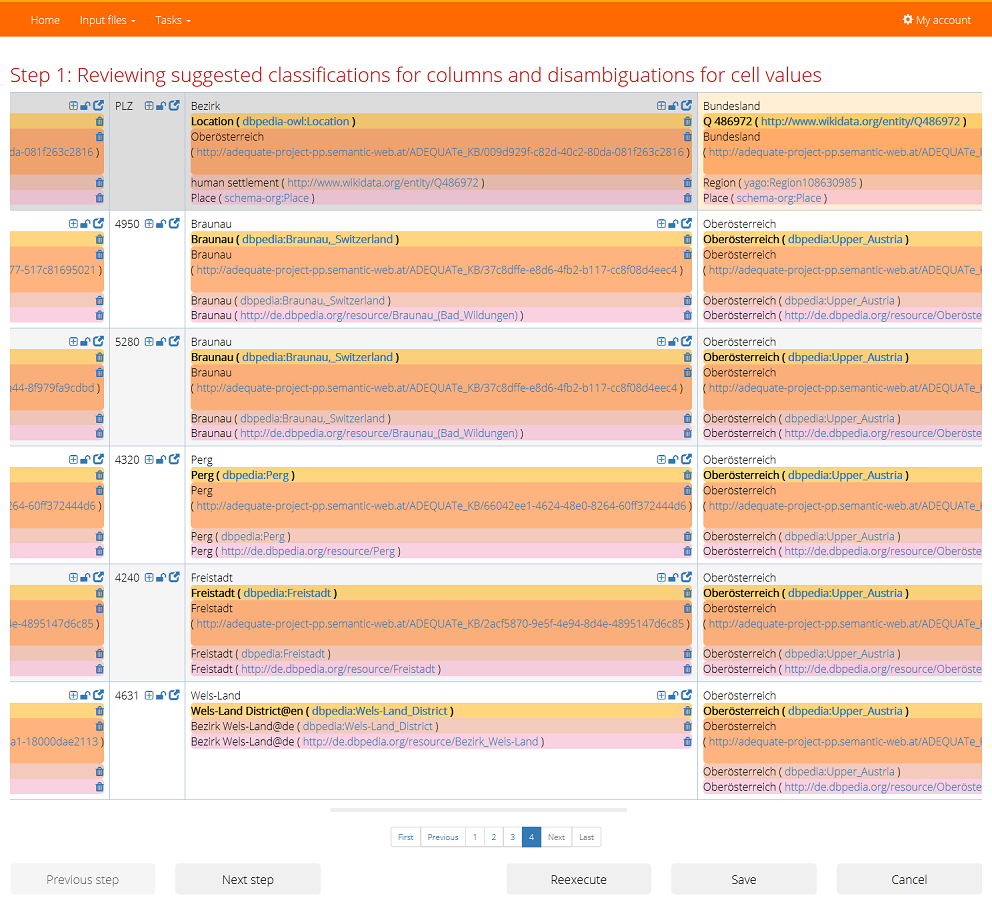
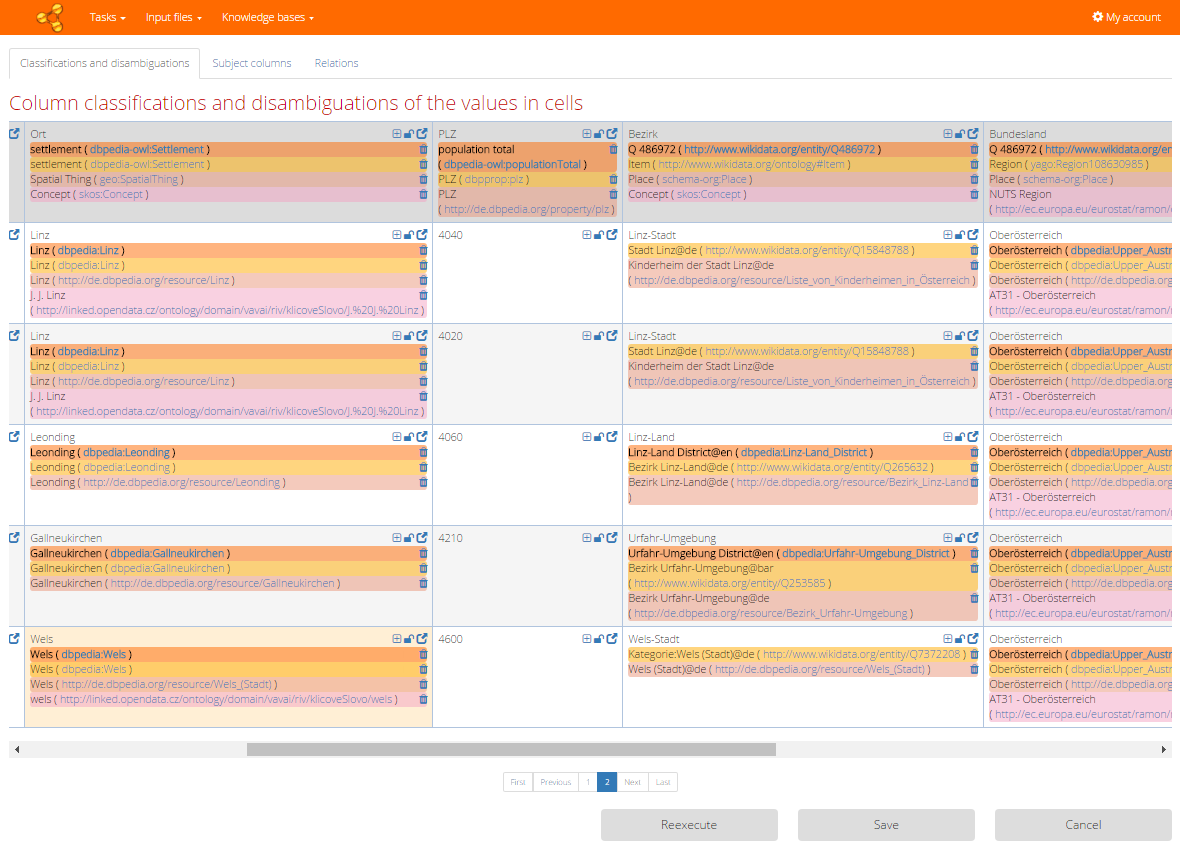
Classifications and disambiguations
In the first tab you can review resources suggested as classifications of the columns and disambiguations of the cells. Resources from different knowledge bases are distinguished by colours and made bold for the primary knowledge base. The name of corresponding knowledge base is shown in a tooltip (when the mouse is over) of the resource label. The link next to the resource label opens a resource web page (in a browser's new tab).
Missing resource annotation can be caused by several reasons: the way how the algorithm viewed the processing of column is shown in the tooltip (when the mouse is over) of the column header text. There are four possible ways the algorithm can view a column:
- Named entity - the algorithm recognized the values of column as named entities (uniquely identifiable by an URI from the base) and performed classification and disambiguation process normally.
- Non-named entity - the algorithm assessed that the values are not named entities (for example when there are numbers), so the classification and disambiguation process was skipped for that column.
- Ignored - the column was intentionally ignored, because the user asked so in the feedback to previous task run.
- Compulsory - the column was classified and disambiguated although it was not recognized as named entity, because the user asked so in the feedback to previous task run.

Related feedback
You can adjust basic feedback settings directly from the table of results. The lock icon shows whether the feedback is set for the particular cell or column header. If so it should be reflected by the algorithm in the next run of the task. Initially it is unlocked. When you adjust some feedback, it locks automatically. You can also lock and unlock it manually.
- "Bin" icon - deletes resource annotation for particular knowledge base. For cells it means that the disambiguation of the cell will be skipped, for column headers is means that the whole column will be skipped (ignored).
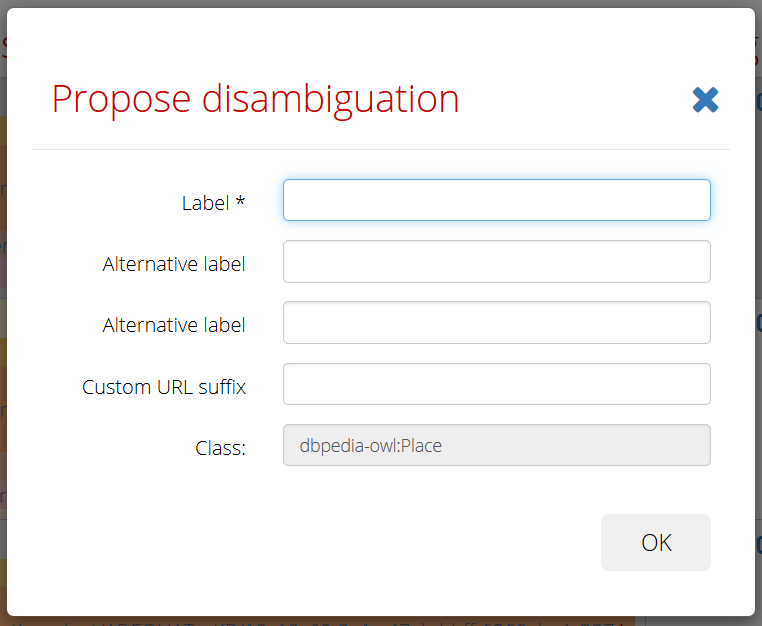
- "Plus" icon - opens dialog for proposing a new resource, which will be then used for new disambiguation of the cell (or classification of the column). It is possible to propose resources only to the primary knowledge base (which must be modifiable).
- "Arrow" icon - opens a dialog with detail of classification/disambiguation (described bellow).
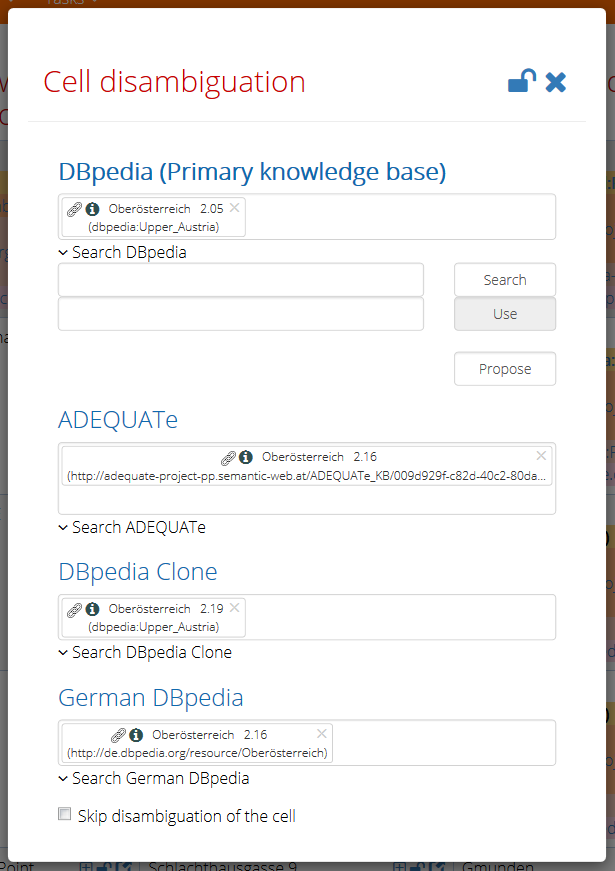
The detail dialog shows annotations found for cell/column in their entirety. It offers more options for feedback adjustment than the table perspective.
The smart select box displays chosen annotation for each knowledge base. When you click to the select box next to the chosen annotation, other candidates suggested by the algorithm are displayed and you can select one of them as the new annotation resource. Every item in the select box shows label, URI of the resource and a score computed by the algorithm. The available commands in the smart select box are the following:
- By clicking the "i" icon you can open the resource web page (in the new tab, if the underlying base has such HTML representation published).
- The "chain" icon opens the LodLive component with the corresponding resource.
- The "cross" icon deletes the annotation which means that the cell / column will be skipped in the next run.
When you want to set another resource (different from the candidates provided by algorithm), you can search it in the associated knowledge base (by the label). Then select one of the results and Use it as the annotation. For the primary knowledge base you can also propose completely new resource (as described above). By the last checkbox you can completely skip the cell/ignore column (for all knowledge bases). The lock icon works in the same way as in the result table.
Subject columns
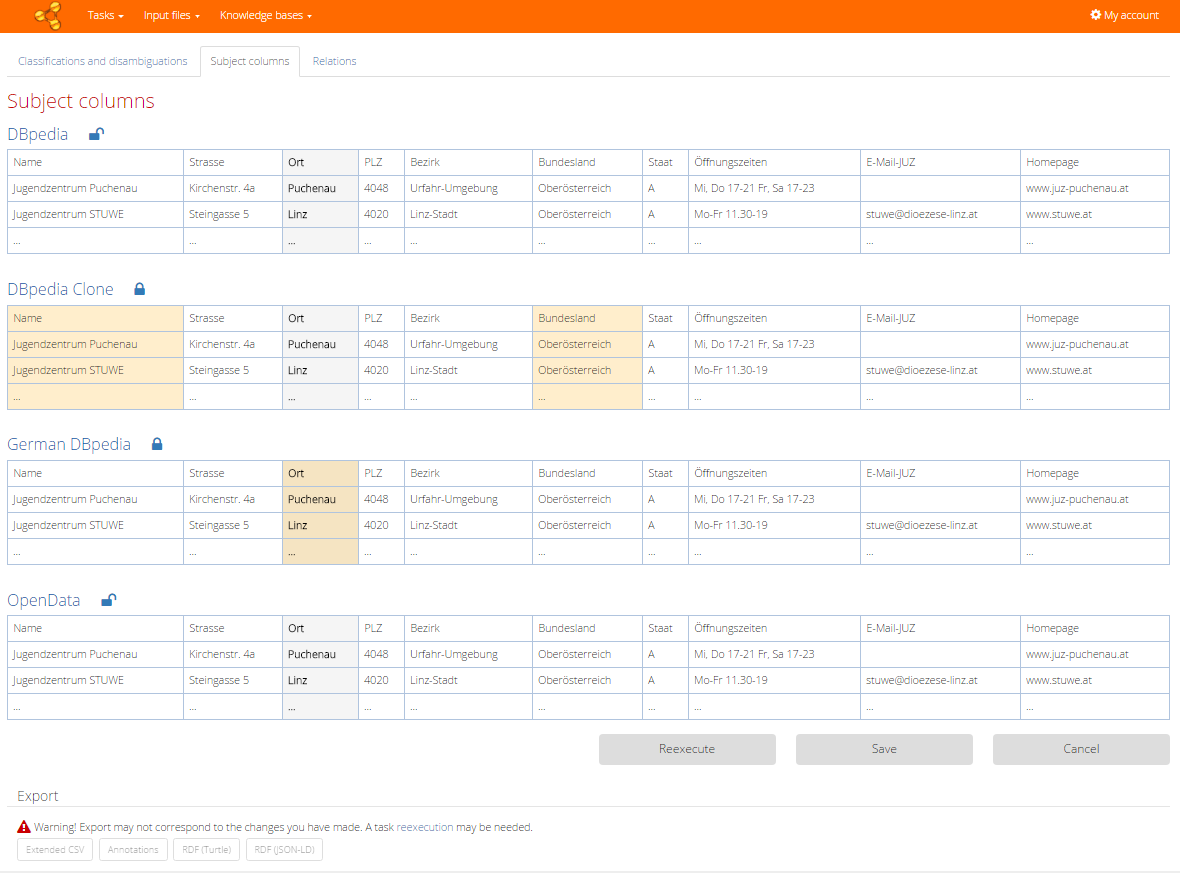
In the second tab (available only for a task which does not process statistical data - see Task configuration) you can review suggested subject columns. Subject columns serve as sources for relation discovery (depicted in the third tab). The subject column suggested by algorithm is emphasized in the table preview for each knowledge base. Grey marked column shows an algorithm suggestion (or user feedback from previous run). When we want to mark another columns as subject columns, just click on the desired columns and they will be emphasized by orange color. Adjusting of this part of the feedback is also confirmed by the lock icon which works in a similar way as in the previous tabs.
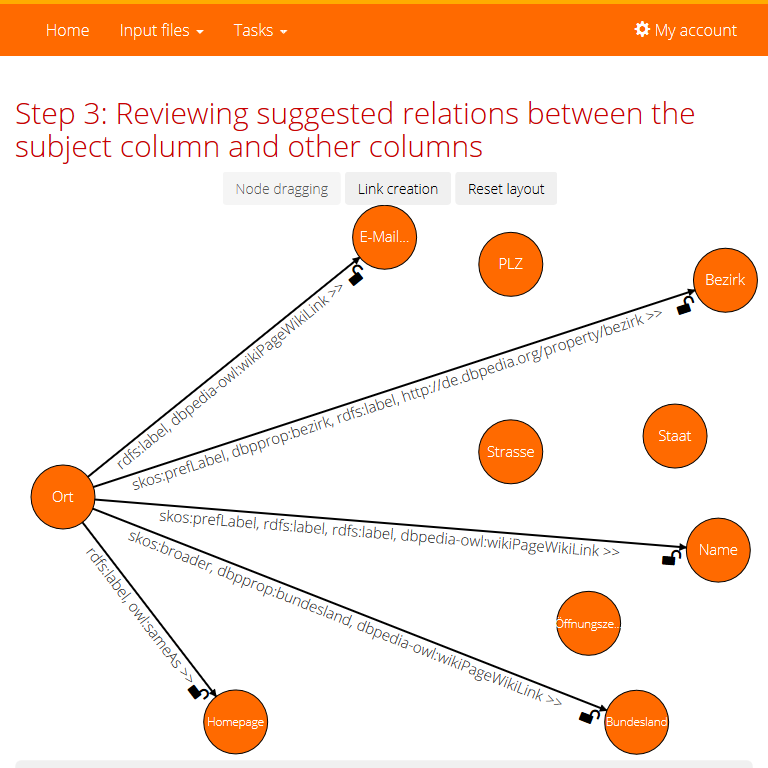
Relations
In the third tab (also only for task which does not process statistical data) you can review suggested relations between the subject column and other columns. Relations are depicted in the directed graph, where vertices represent columns and relations are represented by edges labelled with predicate resources found in the knowledge bases. Click on the edge label opens dialog with details similar to those for classifications or disambiguations in the first tab. Lock icons work also in the same way.
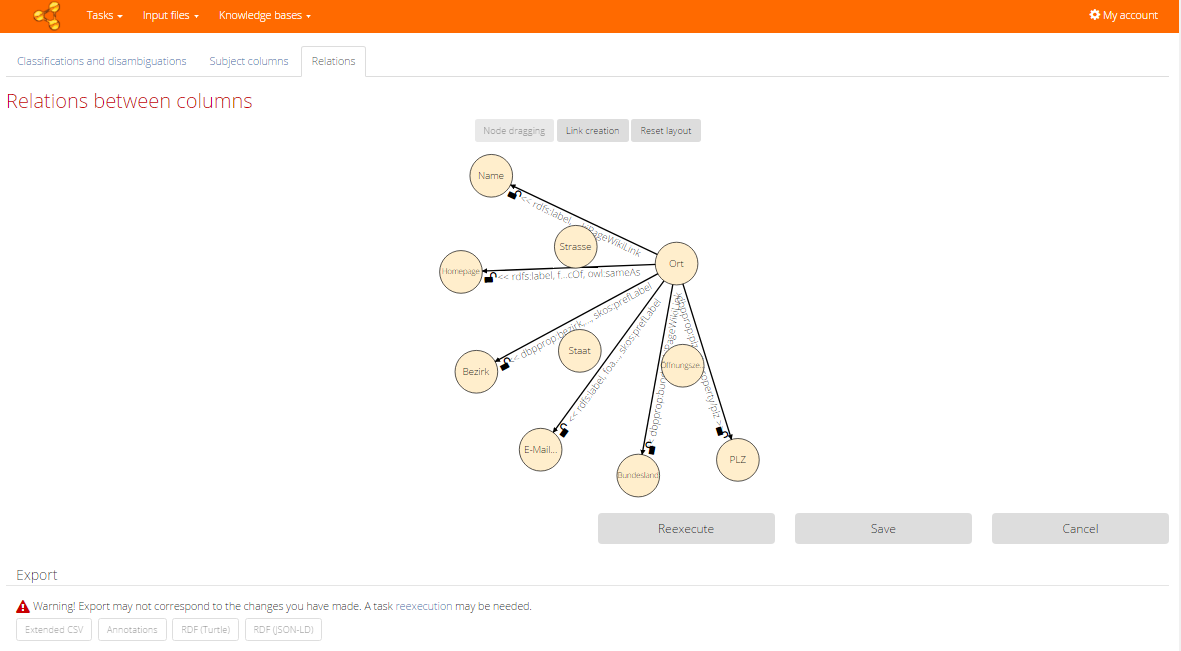
First mode of the graph, called Node dragging, allows dragging of the vertices around the screen, thus changing the layout. When you switch to the second mode by the Link creation button, then you can add new edges representing new relations between some columns. After their creation it also opens the dialog with details, where you can search or propose the new predicate resource annotation.
Tab for statistical data processing
When you set the statistical data processing check box to turned on state in the Task configuration, the subject column detection and relation discovery parts of the algorithm are skipped. The algorithm instead prepares statistical annotations for a data cube. This means that the algorithm will determine which columns are dimensions and which one measures. Initially all named entity columns are considered for dimensions and non-named entity columns for measures.
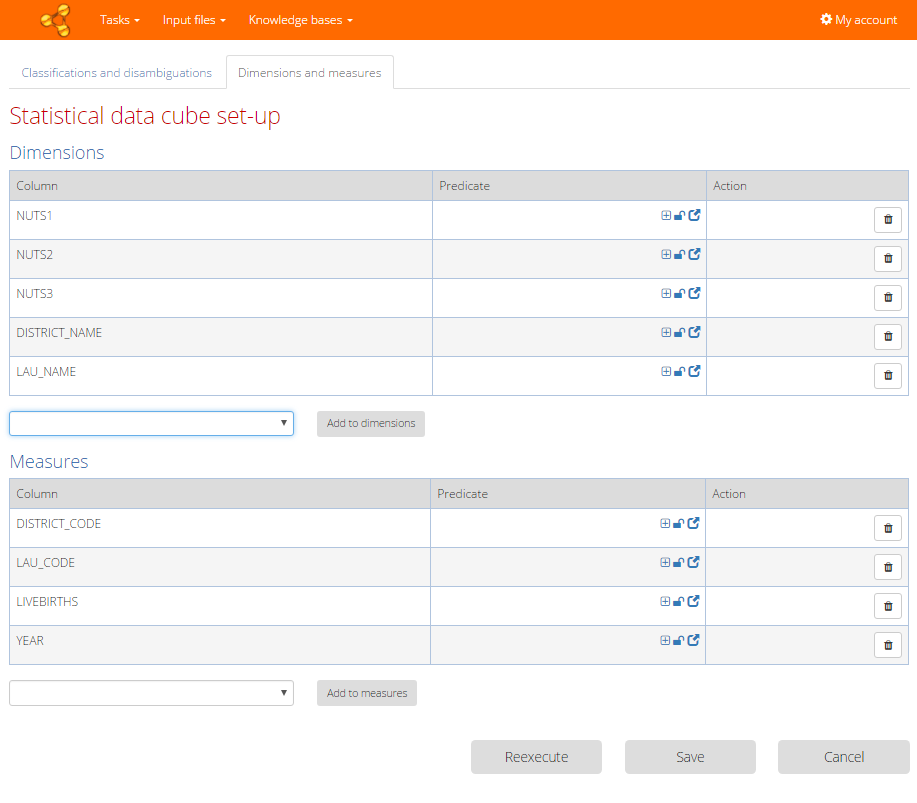
You can eventually change this decision. "Bin" icon removes a column from particular group, "Add to ..." buttons add selected column to the group.
After that you should set the predicate resource in a way similar to classification or disambiguation. "Plus" icon proposes new resource, lock icon confirms the settings and "Arrow" icon opens the dialog with details, where you can search resources in the knowledge base. Predicate resources are set only for the primary knowledge base. The predicates are eventually used in the next run of the algorithm (if you hit Reexecute) for creating the so-called "Observations" according to the data cube vocabulary.
Reexecute
To consider changes which were provided as a feedback, the algorithm must be reexecuted. You can reexecute the task directly by the "Reexecute" button. Or you can just save the provided feedback by the "Save" button and start the execution later.
Export
At any time you can export the results by buttons at the end of the Result page. Only the result of the last finished execution is used as basis for the exports (thus ignoring a feedback that was not baked in by the task re-execution).

- Extended CSV - file containing columns of the task input file plus extra columns with annotations (disambiguation resources) . The extra columns are easily distinguishable from the original ones, because they are named *_url where * stands for the original column name.
- Annotations - annotations for columns of the extended CSV file according to the CSV on the Web standard (including annotations of virtual columns used for classifications, relations or statistical data cube).
- RDF - linked data triples in form of RDF describing disambiguated values with classification and relations (or data cube observations in case of statistical data processing).